This website stores cookies on your computer. These cookies are used to improve your website experience and provide more personalized services to you, both on this website and through other media.
Accept
EdTechReviewEdTechReview
  • News
  • Trends
  • Insight
  • eLearning
  • Research
  • Dictionary
  • EdTech Voices
  • More
    • Data & Statistics
    • Reviews
    • AWS for Education
    • Events

    Resources

    • Infographics
    • Reports & Case Studies
    • Videos
    • Books
    • Webinar

    Needs

    • 1:1 Learning
    • 21st Century Education
    • 21st Century Leadership
    • 21st Century Learning
    • 21st Century Teaching
    • 3D Printing
    • More Tags

    For

    • Students
    • Teachers/Educators
    • Administrators
    • Entrepreneurs/Startups
    • Govt. Officials/Policymakers
    • Parents
Explore
Search
Contribute
  • Submit A Post
  • EdTech Trainers and Consultants
  • Your Campus EdTech
  • Your EdTech Product
  • Your Feedback
  • Your Love for Us
  • EdTech Product Reviews
ETR Resources
  • About
  • Medicine
  • Mission/Vision
  • Children
  • Team
  • Coronavirus
  • Services
  • Nutrition
  • Testimonials
  • Disease
  • Authors
  • Sponsor
  • Stars
  • Partner
  • Screen
  • Advertise
  • Culture
  • Our Clients
  • Media
  • Media Kit
  • Videos
  • Press Release
  • FAQ’S
Reading: Performance Analysis and Scope for Betterment
Aa
EdTechReviewEdTechReview
Aa
Search
  • News
  • Trends
  • Insight
  • eLearning
  • Reviews
  • Dictionary
  • EdTech Voices
  • Data & Statistics
  • Research
  • AWS for Education
  • Events
  • Voices
Follow US
EdTechReview > Trend & Insight > Insight > Performance Analysis and Scope for Betterment
Insight

Performance Analysis and Scope for Betterment

Sudha
Sudha Published July 14, 2018
Share
5 Min Read
Performance Analysis and Scope for Betterment
SHARE

Standard deviation graph and what does it mean to educationist?

AdvertisementWhy this Ad?

The representation of ‘μ’ refers to the mean or average in statistical terms. Standard deviation shows the distribution of values around the mean. The above bell curve shows the distribution within 1 standard deviation(σ), 2σ and 3σ. The distribution shows that 68% of any given data lies within + 1σ, while 95% of the data lies within + 2σ and 99.7 % of data lies within + 3σ. The same applies for analysis data of performance from the education scenario. The standard deviation within a dataset can help us understand how students perform and what modification to be done to achieve a better outcome.

Image source: http://blog.shakehandwithlife.in/2014/06/normal-curve-area-under-normal-curve.html

The data distribution around the mean value signifies the overall performance of the given group. Small standard deviation shows the less differences(variance) among scores of individuals within a group which result in the increase in sharpness of the peak. Such group-learning is more organised and needs to be promoted on the same lines. As the group flattens, it means that variance among performance in the given group is large. This shows that either adopted methodology is not working out within the groups. Instructional design or methods adopted for the concept delivery or assessment needs immediate change.

Note: Sometimes a sharp peak may indicate the leniency or the easiness in the set exam. Above said condition is considered only for level appropriate examinations conducted by on a large scale without interference or influences of any sort. Thus, the curve can also be used to determine the standard of the examination under consideration when verified among different groups of the same class.

std-deviation-same-mean

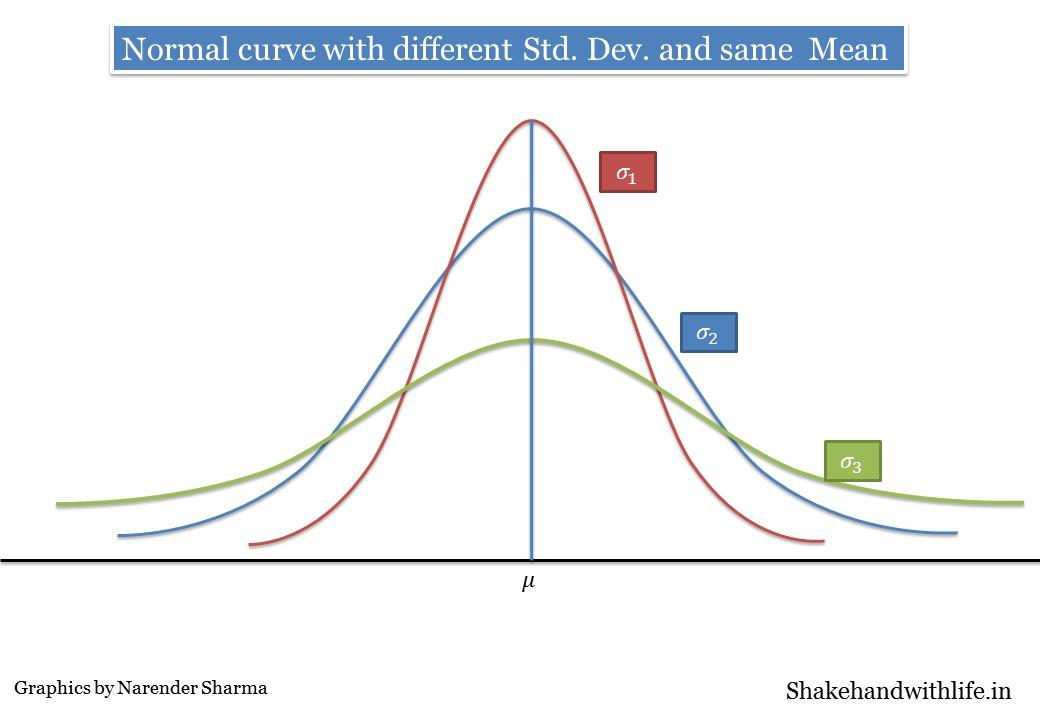
Image source: https://www.quora.com/What-does-SKEWED-DISTRIBUTION-mean

The increased sloping of the curve towards the right or left is referred to as skewness. When a normal distribution is skewed it means that the position of the mean shifts from the centre to the right or left. When the skewness is towards the right, it means a positive skew and when it is towards the left, it is negative. The skewness when related to education show the class performance.   Skewness in educational data represents the variation in the learning differences that has creeped into the classroom. Normal condition where all three mean, median and mode coincide is an ideal case, however, with the slope we can understand whether most of learning has happened or not. A positive skew is what we generally hope for, which indicate most learning has happened while a negative skew indicate that general learning has not happened for the concept under considered.

Skewness also predicts the learning achievement among the learners. Negatively skewed data must be analysed with more care to understand the variation in the learning process. The variance among the data from the mean shows that most learner achievement is far below average. This can indicate many aspects in the classroom learning starting from

  •         Change in instructional design
  •         Learner types correlating the concept delivery
  •         Period of delivery
  •         Change in teacher during the delivery
  •         Complexity in curriculum
  •         Standard of question paper etc.,

Skewness of the data, thus requires further analysis for better understanding of various pitfalls discussed. Further categorisation on learning performances can also be done using statistical distribution. This can also be done on individual performance for various subjects concerned to understand the details of the complex issue of learning.

The above information is more generalized and is not considering any particular data, individual data shows more information regarding the performance and its scope for improvement. The need for data analysis in education has increased further with the involvement of technology in the field of learning. When performance, properly supported through data analysis, provides the right path for the learning journey of an individual.

TAGGED: 21st Century Teaching, Administrators, Data Analytics, Education Data, Teachers/Educators, Tips for Administrators, Tips for Teachers/Educators
Share This Article
Facebook Twitter Whatsapp Whatsapp LinkedIn Reddit Telegram Email Copy Link
Previous Article AWS EdStart Launched in India: Aimed to Bring Quality Tech to Classrooms AWS EdStart Launched in India: Aimed to Bring Quality Tech to Classrooms
Next Article While Going All Tech are We Leaving Behind the Social & Emotional Growth? 5 Best Videos to Refer When Talking of Social Emotional Learning
AdvertisementWhy this Ad?

Latest EdTech News To Your Inbox

Stay Connected

Facebook Twitter Youtube Instagram Linkedin


AdvertisementWhy this Ad?

Latest EdTech News To Your Inbox

Stay Connected

Facebook Twitter Youtube Instagram Linkedin
AdvertisementWhy this Ad?

You Might Also Like

The Future of Higher Education: Navigating the Path Ahead
Insight

The Future of Higher Education: Navigating the Path Ahead

July 18, 2023
Next Education Collaborates With Acacia University to Revolutionise Tech Education in India
News

Next Education Collaborates With Acacia University to Revolutionise Tech Education in India

July 18, 2023
Self-Directed Learning: Unleashing the Potential of Today's Students
Insight

Self-Directed Learning: Unleashing the Potential of Today’s Students

July 7, 2023
Storytelling in Nursery Schools: Igniting a Love for Books and Language
Insight

Storytelling in Nursery Schools: Igniting a Love for Books and Language

July 3, 2023
The Latest Trends and Their Impact on Medical Education
Insight

The Latest Trends and Their Impact on Medical Education

June 20, 2023
The Post-Pandemic and the New Techniques to Train Teachers for Continued Education
Insight

The Post-Pandemic and the New Techniques to Train Teachers for Continued Education

June 19, 2023
The Power of Corporate Learning
Insight

[Infographic]The Power of Corporate Learning

June 15, 2023
EdTech Investors Have Responsibility for Children’s Education
Insight

EdTech Investors Have Responsibility for Children’s Education

June 12, 2023
Show More
EdTechReviewEdTechReview

H433, 2nd Floor, Vikaspuri, New Delhi, India, 110018
Phone: 011 41321030

Follow US

Copyright © EdTechReview. All Rights Reserved.

  • Home
  • Advertise
  • Event Associations
  • Press Release
  • About
  • Services
  • Contribute
  • News
  • Trend & Insight
  • Data & Statistics
  • eLearning
  • Reviews
  • Research
  • Voices
  • Dictionary
  • Tags
  • Resources
  • Events
  • Courses
  • EdTech Product for Review
  • Our Clients
  • FAQ’S
  • Contact Us
  • Important Links
  • Sitemap
  • Terms of Use
  • Privacy Policy
newsletter
Join 100K+ subscribers!

Subscribe to our weekly newsletter that brings the latest EdTech news, trends, insights, reports, interviews, etc. for educators, school leaders, entrepreneurs, investors, & others.

Zero spam, Unsubscribe at any time.
Welcome Back!

Sign in to your account

Lost your password?